Statistics related to the ongoing ISL 2016 (As of Nov 16, 2016)
Total Matches Played: 40
Total Goals: 82
Average Goals/Match: 2.05
68% of the matches in ISL 2016 are resulting in an outcome.
Points Table
League Standings
| Team | Played | Won | Lost | Draw | GF | GA | Points |
|---|---|---|---|---|---|---|---|
| Delhi Dynamos FC | 10 | 4 | 1 | 5 | 18 | 10 | 17 |
| Mumbai City FC | 11 | 4 | 3 | 4 | 9 | 8 | 16 |
| Kerala Blasters FC | 10 | 4 | 3 | 3 | 9 | 8 | 15 |
| Atlético de Kolkata | 9 | 3 | 2 | 4 | 11 | 10 | 13 |
| Chennaiyin FC | 10 | 3 | 3 | 4 | 12 | 14 | 13 |
| FC Pune City | 10 | 3 | 4 | 3 | 8 | 10 | 12 |
| FC Goa | 11 | 3 | 6 | 2 | 8 | 14 | 11 |
| NorthEast United FC | 9 | 3 | 5 | 1 | 7 | 8 | 10 |
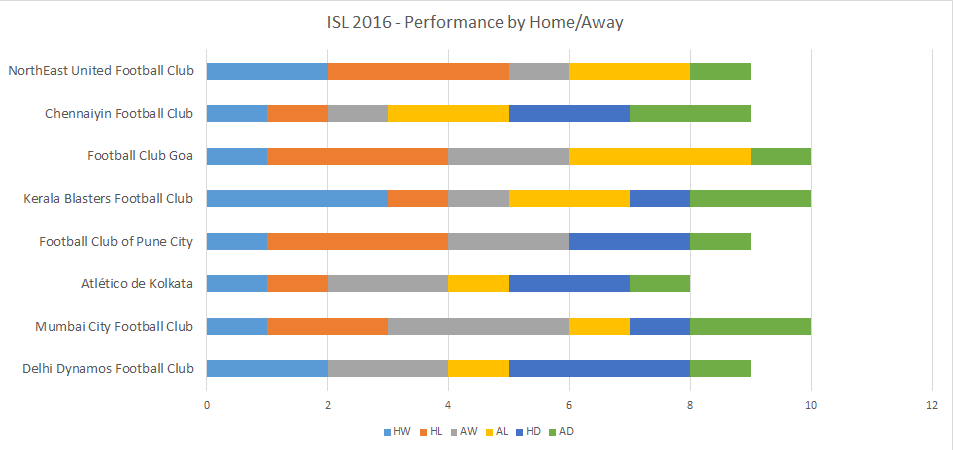
Club Performance by Clubs in ISL 2016
The chart shows that Delhi Dynamos are most comfortable playing at Home and NorthEast United and FC Goa have most number of losses playing at their home ground

HW=Home Win, HL=Home Loss, AW=Away Win, AL=Away Loss, HD=Home Draw, AD=Away Draw
Team Performance
Delhi Dynamos have accounted for nearly accounted for 56% of all goals scored in ISL 2016 thanks to the combination of Pereira, Gadze and Lewis.
2016 Top Goal Scorers
Goal Scored by Indian vs Overseas Players
Goals by Game Progress
See the Latest Stats
See the Latest Points Table and Upcoming Matches
View Complete Fixtures
