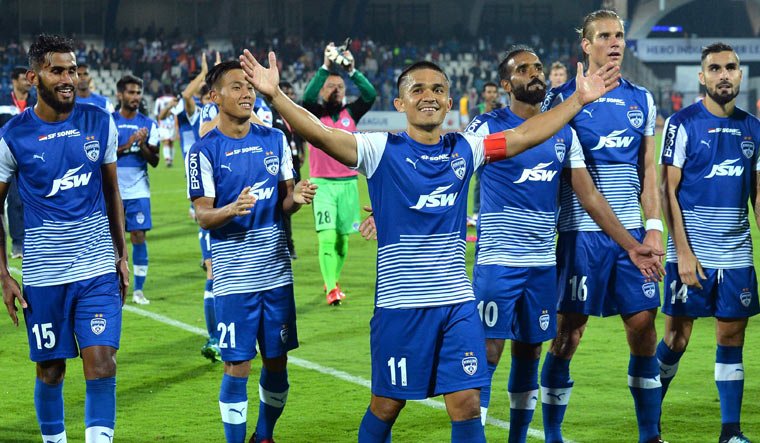
Indian Super League 2018-19 Results and Analysis (As of Match 64)

Total Matches Played: 64
Total Goals: 169
Average Goals/Match: 2.64
Matches with Results: 43 (67%)
Drawn Matches: 21 (33%)
Results v/s Draws
2018-19: Points Table
| Team | Played | Win | Loss | Draw | Points |
|---|---|---|---|---|---|
| Bengaluru FC | 13 | 9 | 1 | 3 | 30 |
| Mumbai City FC | 13 | 8 | 2 | 3 | 27 |
| NorthEast United FC | 14 | 6 | 3 | 5 | 23 |
| FC Goa | 12 | 6 | 3 | 3 | 21 |
| Jamshedpur Football Club | 13 | 4 | 1 | 8 | 20 |
| ATK | 13 | 4 | 4 | 5 | 17 |
| FC Pune City | 12 | 3 | 7 | 2 | 11 |
| Kerala Blasters FC | 13 | 1 | 5 | 7 | 10 |
| Delhi Dynamos FC | 12 | 1 | 7 | 4 | 7 |
| Chennaiyin FC | 13 | 1 | 10 | 2 | 5 |
| Team | HW | HL | AW | AL | HD | AD |
|---|---|---|---|---|---|---|
| Bengaluru FC | 5 | 0 | 4 | 0 | 2 | 1 |
| Mumbai City FC | 5 | 1 | 3 | 1 | 1 | 2 |
| NorthEast United FC | 2 | 1 | 4 | 1 | 4 | 1 |
| FC Goa | 4 | 1 | 2 | 1 | 1 | 2 |
| Jamshedpur Football Club | 3 | 0 | 1 | 0 | 3 | 5 |
| ATK | 2 | 3 | 2 | 3 | 1 | 4 |
| FC Pune City | 2 | 3 | 1 | 3 | 1 | 1 |
| Kerala Blasters FC | 0 | 3 | 1 | 3 | 4 | 3 |
| Delhi Dynamos FC | 0 | 3 | 1 | 3 | 3 | 1 |
| Chennaiyin FC | 0 | 5 | 1 | 5 | 1 | 1 |
HW=Home Win, HL=Home Loss, AW=Away Win, AL=Away Loss, HD=Home Draw, AD=Away Draw
2018-19 Top Goal Scorers
Goals by Game Progress
| Period | Goals |
|---|---|
| 0 – 18 Min | 31 (18%) |
| 19 – 35 Min | 30 (18%) |
| 36 – 55 Min | 28 (17%) |
| 56 – 75 Min | 27 (16%) |
| 75+ Min | 50 (30%) |
